+49 (0)421 59630721 info@keppler.de Mon–Fri, 9:00–17:00
Home / Portals / vNOC42
IT portal vNOC42

Every ship needs a bridge

vNOC42 is your virtual Network & Security Operation Center: a command centre in the browser where you keep an eye on the state of your entire IT, and which can warn you early, before a fault turns into an outage.

Radar domes and mast on the bridge of a ship at dusk
Scope of services

What vNOC42 does for you

From taking inventory and ongoing monitoring to providing evidence to your insurer: everything in one place.

Capture

You map your IT structures individually: devices, networks, internet connections and services. vNOC42 helps you find and add missing information.

Monitor

Sensors based on open-source software report any status values regularly and in encrypted form directly from your IT to the portal, around the clock, 365 days a year.

Alert

You define any number of triggers for each sensor. In the event of an alarm, you, your administrators or your IT service provider are informed by e-mail or SMS. Status and alarms appear in real time.

Document

The captured data is used to create the IT operations manual and the IT emergency manual. You can save a backup of your current IT configuration in the portal at any time.

Analyse

Reports for inventory lists, warranty periods and IP lists, plus your own reports on all objects. Analyses uncover risks and errors, such as duplicate IP addresses, network loops or cables that slow down the network.

Secure

The IT-Grundschutz Compendium of the BSI (German Federal Office for Information Security) provides instructions for your compliance. On request, you receive current security advisories tailored to your profile by e-mail.

How it works

Your own bridge in four steps

01

Capture your inventory

You map your IT in the portal; on request, we support you with this.

02

Set up sensors

Open-source sensors deliver the status values from your IT, encrypted and regularly.

03

Define triggers

You determine who is alerted by e-mail or SMS, and when.

04

Monitor & analyse

Real-time status, reports and detailed logs for later analysis.

Status API

The status of your IT in your own control room

A read-only REST interface brings the status of your monitored systems to where you already look: your dashboard, your ticket system or your control room. Overall status, systems with their last report and the event journal of the last 30 days, as JSON.

Included in all paid plans. Keys are created by the account administrator with two-factor sign-in.

API description (OpenAPI)
  • Read-onlyThe interface only answers queries. Nothing in the portal can be created, changed or deleted through it.
  • One key, one accountEvery key belongs to exactly one account, works only from the IP addresses you allow and expires after twelve months at most. Revoking a key takes effect immediately.
  • Only what you releaseYou choose the scopes and, if you wish, individual systems. The interface does not hand out credentials, notes, users or invoices.
  • TraceableEvery request is logged, including rejected ones. You can see the requests made with your keys in the portal for 90 days.
Access & security

Accessible everywhere, well protected

With vNOC42, a person, an organisation or a company monitors the operation and security of its own IT, in particular networks and internet connections, and secures it according to methods such as the IT-Grundschutz of the BSI.

  • Anytime, anywhereLogin with smartphone, tablet or PC
  • Two-factor loginalso with passkeys
  • Additionally via IP rangesAccess optionally only from defined networks
  • Operation in the EUin the AWS European Sovereign Cloud with data centres in Brandenburg
  • Cyber security situation overviewpublic security information collected daily
  • Traceableextensive logs for the analysis of IT events
Insights into the portal

Three perspectives on your IT

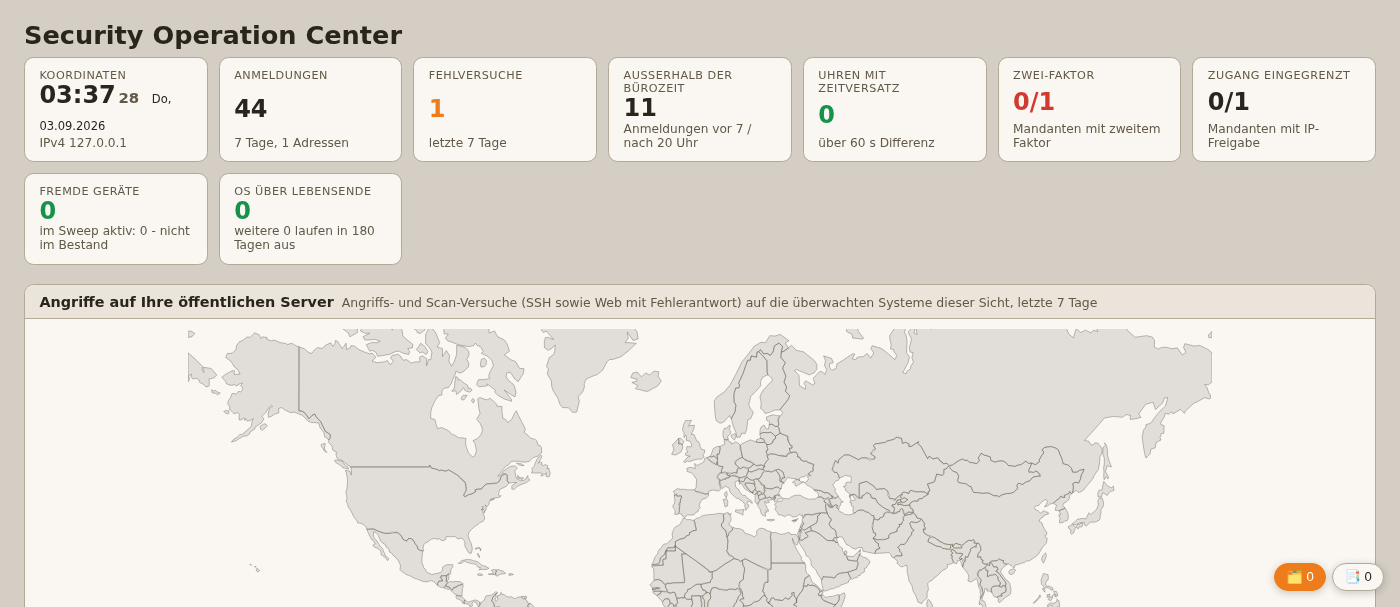
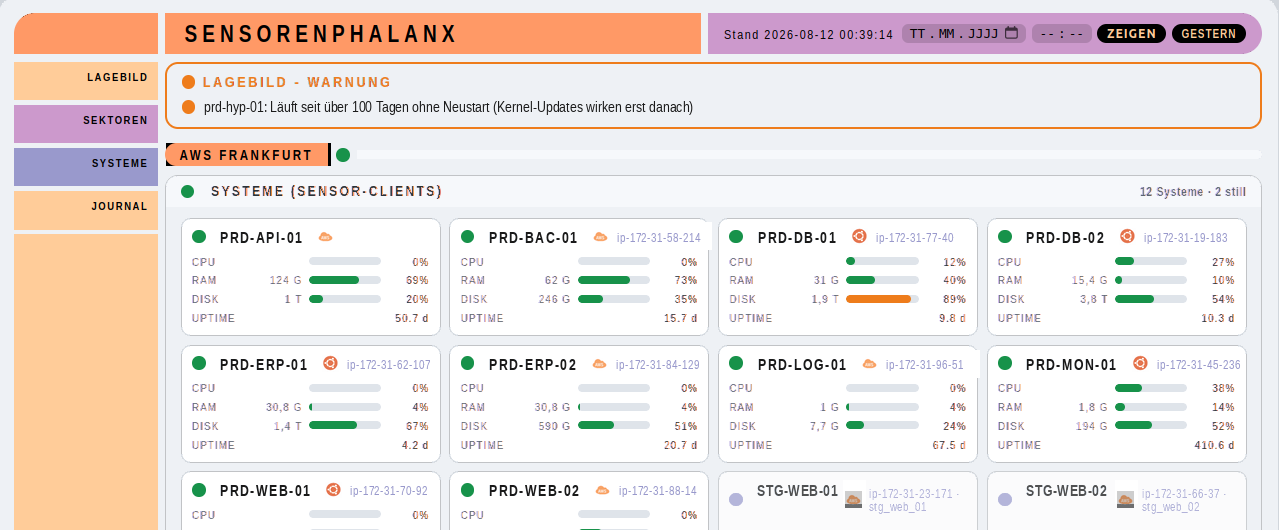
The Network Operation Center shows whether everything is running. The Security Operation Center shows whether anything is vulnerable. The Sensorenphalanx (sensor phalanx) combines both into one situation overview.
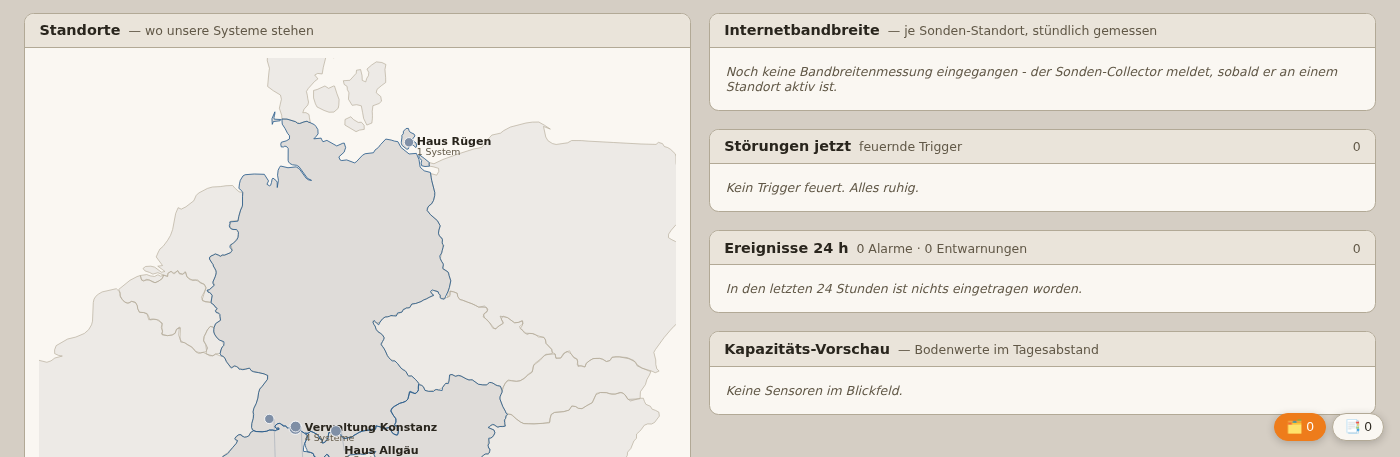
vNOC42 Network Operation Center in the demo account: map of locations, faults and events
NOC · Network Operation Center

Is everything running?

The NOC is the overview for operations: your locations on the map, firing triggers, the events of the last 24 hours and the availability of your systems.
  • Locations and systems at a glance
  • Internet bandwidth per location, measured hourly
  • Capacity forecast from the history of measured values
vNOC42 Security Operation Center in the demo account: logins, failed attempts, two-factor and attack map
SOC · Security Operation Center

Is anything vulnerable, and would you notice?

The SOC evaluates the sensor data from a security perspective and makes visible what would otherwise easily go unnoticed.
  • Logins, failed attempts and access outside office hours
  • Unknown devices on the network and operating systems at end of life
  • Open ports, patch status and attacks on your public servers
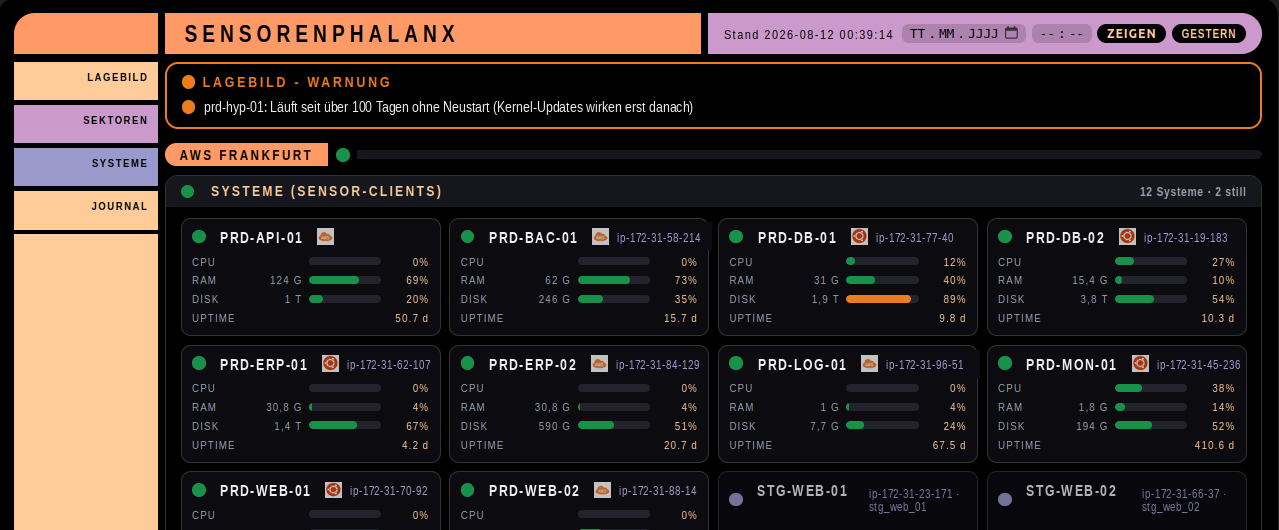
vNOC42 Sensorenphalanx: graphical situation overview with sectors, systems and plain-text findingsvNOC42 Sensorenphalanx: graphical situation overview with sectors, systems and plain-text findings
Sensorenphalanx

The situation overview of your measurement world

The Sensorenphalanx condenses the individual measured values into sectors and locations and formulates findings from them in plain text, such as “Running for more than 100 days without a restart”.

  • Status of every location and system on one screen
  • Findings based on maintainable rules instead of mere individual values
  • Look back: the entire screen with the data as of an earlier point in time

Screenshots from the demo account of the portal with sample data.

Pricing

Plans for every size

Monthly prices net, plus VAT. Billed annually in advance; monthly payment is possible with a 10 % surcharge. The vNOC Free access stays free of charge.

For your own IT

vNOC Free
free 
  • 5 monitored systems
  • 1 site
  • 2 users
vNOC Solo
€8per month
  • 15 monitored systems
  • 1 site
  • 10 users
  • Status API for your own dashboards
vNOC Small Office
€25per month
  • 50 monitored systems
  • 3 sites
  • 20 users
  • Status API for your own dashboards
vNOC Studio
€68per month
  • 150 monitored systems
  • 5 sites
  • 35 users
  • Status API for your own dashboards
vNOC Company
€190per month
  • 500 monitored systems
  • 8 sites
  • 60 users
  • Status API for your own dashboards
vNOC Enterprise
on requestfrom 500 monitored systems
  • ∞ monitored systems
  • ∞ sites
  • ∞ users
  • Status API for your own dashboards

For IT providerswith access for the customers you support

vNOC IT-Admin
€50per month
  • 10 supported customers
  • 25 monitored systems
  • 3 sites
  • Status API for your own dashboards
vNOC IT-Büro
€100per month
  • 25 supported customers
  • 50 monitored systems
  • 8 sites
  • Status API for your own dashboards
vNOC IT-Systemhaus
€150per month
  • 50 supported customers
  • 100 monitored systems
  • 12 sites
  • Status API for your own dashboards
vNOC IT-Dienstleister
€200per month
  • 100 supported customers
  • 150 monitored systems
  • 16 sites
  • Status API for your own dashboards
vNOC IT-Company
€250per month
  • ∞ supported customers
  • 250 monitored systems
  • 20 sites
  • Status API for your own dashboards

More systems without changing plans: add-on “Systems +25” for €15 per month. Prices as of 11 October 2026

All plans and features
Contact

Let's talk about your IT

Whether initial questions, specific consulting needs or a quote: we are personally available to you. No call center, no waiting queue.

Request consultation